This post is the start of a series of blog posts about browser tools. Among those we plan to look into any kind of tool in and around the browser, so mostly things web developers eventually find useful. Let’s dive right in.
Up to here this page loaded ?? assets (or resources) and took ?? seconds to load. All those information were gathered, just now, via the Resource Timing API, which we would like to cover in this article. (If you just see “??” then reading the data didn’t work, do you have an older browser? Anyways read on so you can try if and how the described API works in your browser?) At the end of the article the same stats with the updated values can be found, watch out.
If you reload, the numbers may change.
Resource Timing API
Let us start by looking into the Resource Timing API (on MDN, in the spec), it is part of the Performance API (on MDN, the spec), which you can reach via window.performance in all modern browsers. We will learn how it can be useful to better understand the impact on performance of resources that a website loads, e.g. JS, CSS, images, XHRs and alike.
The specification (or spec) introduces the topic in a very understandable way:
[The spec] introduces the PerformanceResourceTiming interface to allow JavaScript mechanisms to collect complete timing information related to resources on a [website].
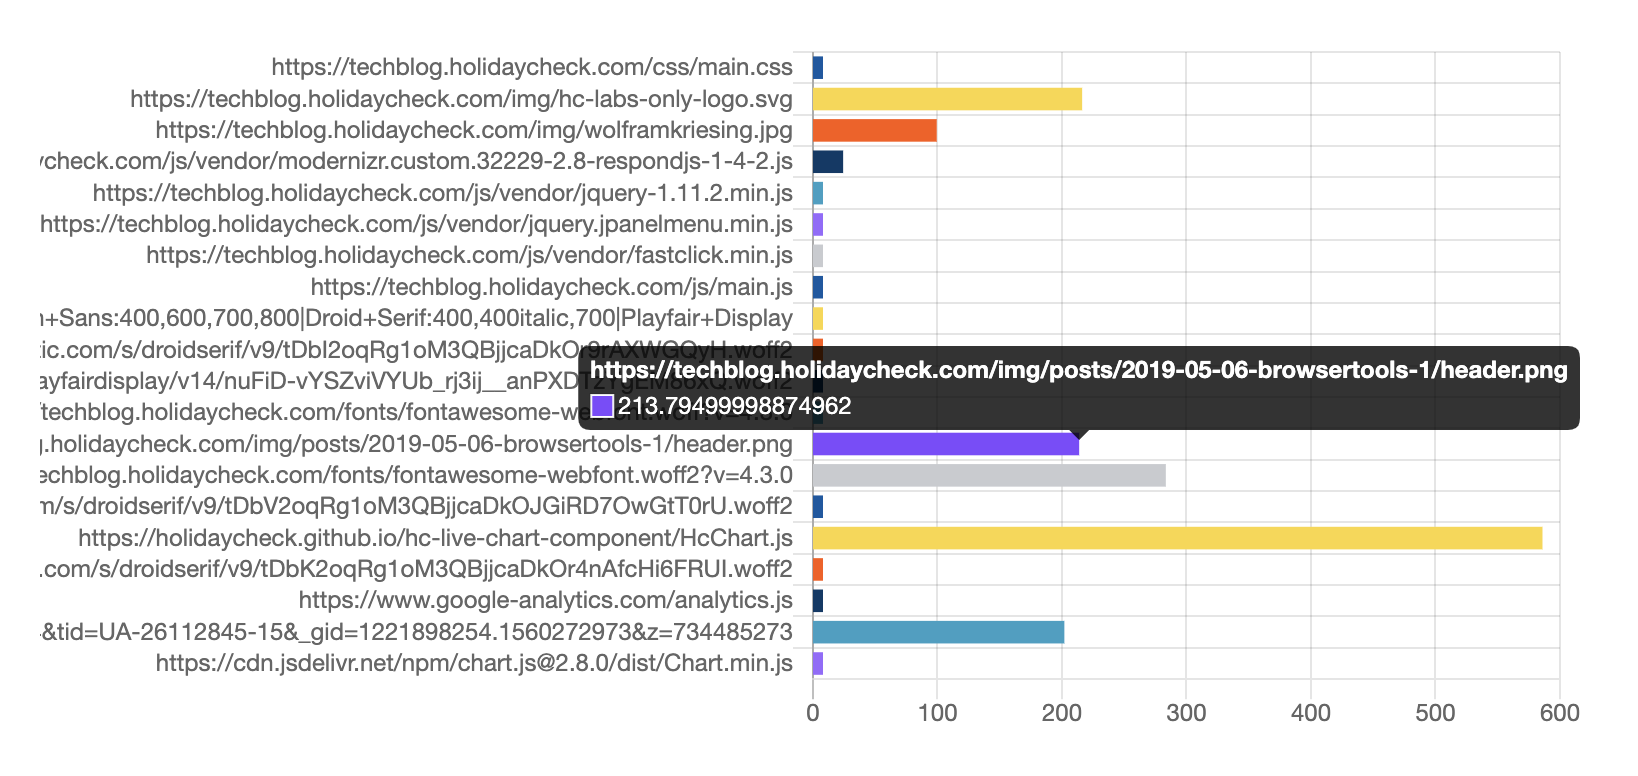
The interface that the spec defines is called “PerformanceResourceTiming”, which is in simple terms the collection of many attributes about one resource that the website loads. For example the duration attribute, which tells us how long it took to load a certain resource. For that we have to read all resources that were loaded, which we do via window.performance.getEntriesByType('resource'). This returns an array of all resources, which contains the name and duration properties (among others):
> window.performance.getEntriesByType('resource')
[{
    // ... shortened
    duration: 14.79000000108499,
    name: "http://techblog.holidaycheck.com/css/main.css",
    startTime: 18.41499999864027,
    responseEnd: 33.20499999972526,
    // ... shortened
}, {...}]
The duration is given in milliseconds. The time is measured using the DOMHighResTimestamp API, which allows for very exact time measuring. Why is this needed? We could have used Date.now(), but the spec says it “does not allow for sub-millisecond resolution and is subject to system clock skew”. Better to have exact timestamps. You can see the sub-milliseconds part in the duration’s value above. So we have reliable time measuring in the browser available, details might become another blog post in this series.
The name is the URL of the resource the website loaded and the API measured.
Let’s sum it all up, by looking at the part of the API we have learned about.
> // Read all resource that our website has loaded.
> const resources = window.performance.getEntriesByType('resource');
> // Filter out the name and the duration.
> const durations = resources.map(({name, duration}) => ({name, duration}));
> durations
[  // shortened for readability
   {name: ".../css/main.css", duration: 14.42500000121072},
   {name: ".../img/hc-labs-only-logo.svg", duration: 18.744999993941747},
   ...
]
The responseEnd Attribute In Use
The duration attribute seen before, is the result of subtracting the responseEnd - startTime attribute (spec). The startTime attribute is the time when fetching the resource started (MDN). The responseEnd is the timestamp when the last byte was received or when the transport connection closes (MDN). The time taken how long loading all resources took, as you saw at the beginning of the article and as you can see at the end again, is calculated by retreiving all responseEnd values and taking the biggest one, as you can see below:
> // Helper function to find the max value in an array.
> const findMax = values => values.reduce((a, b) => Math.max(a, b));
>
> const resources = window.performance.getEntriesByType('resource');
> // Filter out the responseEnd attribute only and find the maximum.
> const allEnds = resources.map(r => r.responseEnd);
> resources.length + ' resources, ' + findMax(allEnds) + ' ms'
If you see this either JavaScript is disabled, or something went wrong :(.
Hint: If you reload, the numbers may change.
Finally
Now that you got here, we pick up the thing we did at the beginning of the page again and list the tiny statistics again. After the event “load” (the whole page has loaded, including all dependent resources such as stylesheets images) this page loaded ?? assets (or resources) and took ?? seconds to load. (If you just see “??” then reading the data didn’t work, do you have an old browser?)
Hopefully this article shows that getting insights into resource timing of a site is possible not only in developer tools, but also right in the browser itself. What you can do with it we leave up to your imagination.
You want to know more? Read part 2 of this series about “Loading Dependencies”.